Overheated areas
Walking around Žilina, heatwaves can feel very different. Using surface temperature
derived from satellite information (Landsat8 imagery), areas that are heating up more than others were identified.
For instance, orange and red areas can indicate a higher exposure of e.g. infrastructure and the population to
heatwaves because these areas are heating up more than others.
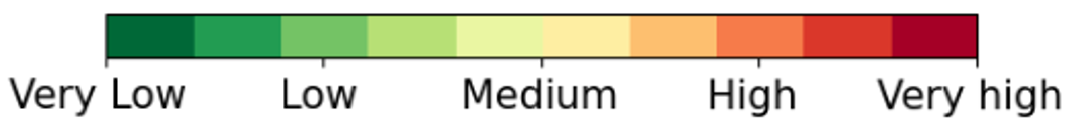
The map shows overheated areas and represents the values from 20°C (dark green) to 60°C (dark red).
The map has been produced based on the data downloaded from RSLab: