Risk Analysis#
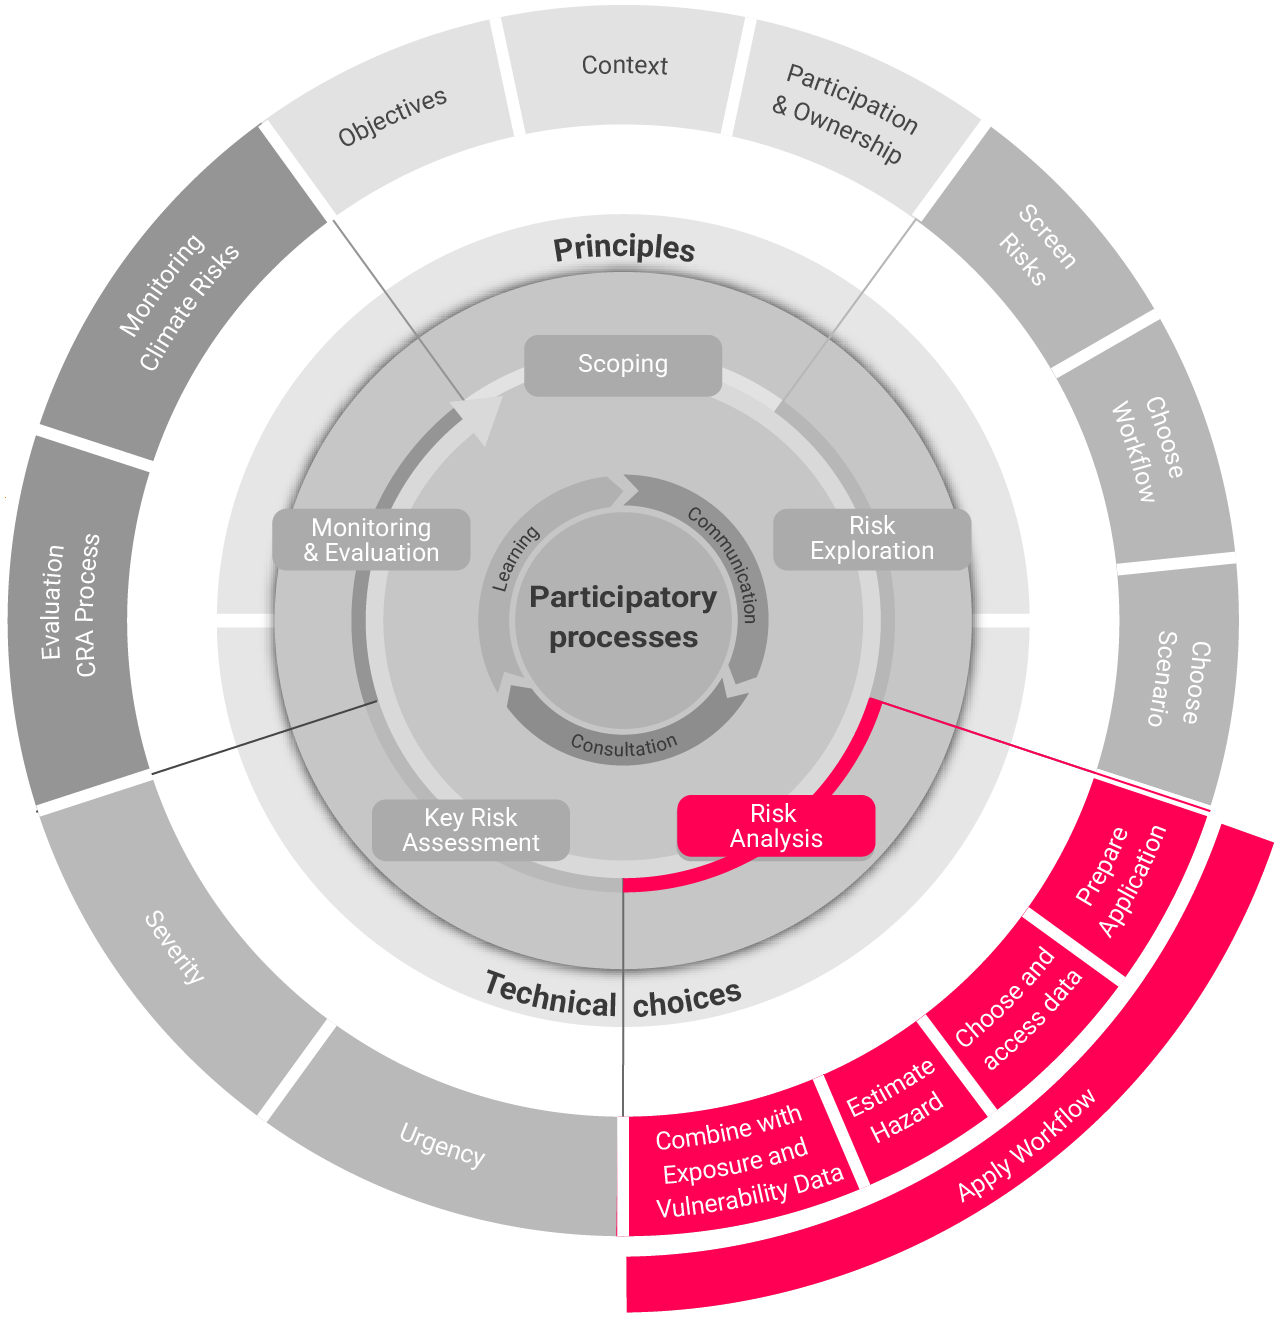
Once the Risk Exploration is completed, the next step is to apply the risk workflow and scenario decisions in the Risk Analysis to estimate risk in a given region. The risk workflows consider four main steps to calculate a region’s individual Climate Risk: Prepare application, choose and access data, estimate the hazard and combine with exposure and vulnerability data. A suitable software environment (e.g., a Python installation) and technical knowledge (e.g., of Python or similar modelling tools and GitHub) is needed for the application of the risk analysis workflows.
Tip
Successful CLIMAAX applicants can run the workflows on the CLIMAAX JupyterHub. In this environment, all workflows are readily available together with the necessary software.
For setting the environment of the selected workflow the user can find all the necessary information in the respective workflow. For this, the user can follow the instructions provided in the workflow repositories on GitHub and here in the Handbook (How to use risk workflows).
Accessing data on hazard, exposure, and vulnerability requires a decision on whether to use precalculated European/large-scale datasets available in the CLIMAAX Handbook about hazard (e.g. wildfire, flood water depth, and heatwave), exposure (e.g. population, critical infrastructure), and vulnerability (e.g. GDP) or to implement own local data. The latter requires advanced users, while basic users can benefit from data provided through workflows. Once this is completed, it is possible to visualize the maps of hazard, exposure, and vulnerability to have a preliminary idea of the hotspots areas potentially affected by high risk.
The Hazard can be estimated either through precalculated, large-scale European hazard maps or through individual, local data hazard maps. As climate risk not only depends on climate-related hazards but also on the exposure and vulnerability of a region/society to the respective hazard, the final step combines hazard data with Exposure and Vulnerability to assess risk according to the equation:
Risk = Hazard × Exposure × Vulnerability
Different visualisation options can describe the risk estimation (Fig. 7): For example, risk can be visualised through a risk map with different colors (e.g., green low risk, red high risk), a map showing exposed population or a diagram of changes of exposed population for a certain area and specific risk categories (e.g. time series of population exposed to high drought risk). More details about the Risk Analysis step, risk workflows, and risk visualization are reported in the CLIMAAX Deliverable 2.4.
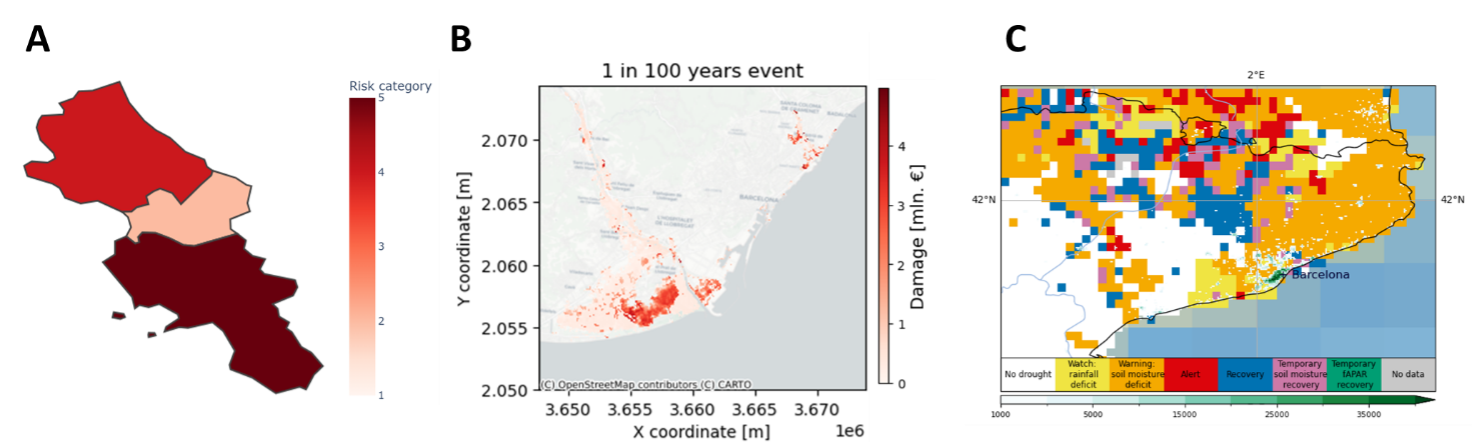
Fig. 7 Examples of the different outputs from the three risk assessment approaches with A drought risk indexing, B coastal flood damage, and C drought exposed population. Credit: CLIMAAX consortium.#
Event-based Climate Storylines
Event-based physical climate storylines (or in brief: climate event storylines) are a complementary approach to produce climate information relevant for decision making. You can find more information on this qualitative risk analysis option here.
Tip
Including the estimation of current climate risk of the respective hazard can serve as a baseline for tracking future trends, which is relevant for the Monitoring and Evaluation step of the CRA.