Hazard assessment - retrieving flood maps for risk assessment of buildings and population exposure#
A workflow from the CLIMAAX Handbook and FLOODS GitHub repository.
See our how to use risk workflows page for information on how to run this notebook.
This workflow is used to retrieve European flood maps of river floods for different return periods. The code can be customised to use local data.
Note
The European river flood maps do not take into consideration possible flood protection structures that may in reality limit the impact of the hazard. Moreover, the resolution of 3 arc-seconds for the flood maps may be unsuitable for particularly complex regions, and the dataset only takes into account large river basins which may make it less useful for areas with smaller rivers. If possible, it is advised to use local data which may lead to a better representation of the ground truth.
Preparation work#
Import modules#
Find more info about the libraries used in this workflow here
These modules are needed to process the data in this workflow and to plot the results.
os: For interacting with the operating system, allowing the creation of directories and file manipulation.
sys: Provides access to some variables used or maintained by the interpreter and to functions that interact strongly with the interpreter. It is always available.
numpy: A powerful library for numerical computations in Python, widely used for array operations and mathematical functions.
pandas: A data manipulation and analysis library, essential for working with structured data in tabular form.
geopandas: Extends the datatypes used by pandas to allow spatial operations on geometric types.
rasterio: For reading and writing geospatial raster data, providing functionalities to explore and manipulate raster datasets.
rasterstats: For summarizing geospatial raster datasets based on vector geometries.
shapely: For manipulation and analysis of planar geometric objects.
osgeo: For translating raster and vector geospatial data formats.
osmnx To easily download, model, analyze, and visualize street networks and other geospatial features from OpenStreetMap.
pyproj: Interface for PROJ (cartographic projections and coordinate transformations library).
matplotlib: Used for creating static, animated, and interactive visualizations.
contextily: For adding basemaps to plots, enhancing geospatial visualizations.
urllib.request: Defines functions and classes which help in opening URLs (mostly HTTP) in a complex world — basic and digest authentication, redirections, cookies and more.
zipfile: Provides tools to create, read, write, append, and list a ZIP file.
socket: pPovides access to the BSD socket interface.
import os
import numpy as np
import rasterio
from rasterio.windows import from_bounds
from rasterio.warp import reproject, calculate_default_transform
from rasterio.mask import mask
from osgeo import gdal, osr, ogr
from shapely.geometry import box, Polygon, shape
from pyproj import Transformer
from matplotlib.colors import LinearSegmentedColormap
import matplotlib.pyplot as plt
import matplotlib.patheffects as pe
from mpl_toolkits.axes_grid1 import make_axes_locatable
import contextily as ctx
import urllib.request
import socket
Define inputs#
In this section different input parameters are set. Please read the descriptions when provided to ensure the appropriate changes are made.
Geographical bounds of area of interest. Positive values denote north and east, and negative values denote south and west.
Code flags (e.g. choosing which maps get produced)
Return periods
Directory locations
Colorbars for maps
## Location (in ESPG:4326) --------------------------------------
# Florence, Italy (Example 1)
Latitude1, Latitude2 = 43.76, 43.79
Longitude1, Longitude2 = 11.24, 11.30

# Žilina, Slovakia (Example 2)
#Latitude1, Latitude2 = 49.2, 49.25
#Longitude1, Longitude2 = 18.69, 18.78

"""#Sevilla, Spain
Latitude1, Longitude1 = 37.31092657797497, -6.020294323590795
Latitude2, Longitude2 = 37.43506820432209, -5.876442087023754"""


# Ordering coordinates
Latitude1, Latitude2 = min(Latitude1, Latitude2), max(Latitude1, Latitude2)
Longitude1, Longitude2 = min(Longitude1, Longitude2), max(Longitude1, Longitude2)

## Return Periods of Interest ------------------------------------
# Return period levels, if using original source pick from [10, 20, 30, 40, 50, 75, 100, 200, 500]
ReturnPeriods = [10, 50, 100, 500]


## Figure Options ------------------------------------------
# Return period for the optional figures. If using original source pick from [10, 20, 50, 100, 200, 500]
ImageReturnPeriod = [10,50,100,500] #At least one input

for value in ImageReturnPeriod:
    if value not in ReturnPeriods:
        raise ValueError(f"Value {value} in ImageReturnPeriod is not present in ReturnPeriods, i.e. workflow is trying to create graphics from a return period not being analysed.\nEither remove it from ImageReturnPeriod, or add it into ReturnPeriod.")

# Maximum Water level in legend. Useful if big discrepancy between river and flood depths exists.
customMaxDepthLegend=-1 #Set as -1 to automatically set highest value found in data as the legend's maximum

# Flood Images (True prints)
    #Flood maps composed as single graphic
flagFloodComposed= True
    #Flood water level difference between two return periods
flagFloodDifference = True

## Figure Colour Scheme -------------------------------
# Water Depth Colorbar for Maps
cmap_h2o = LinearSegmentedColormap.from_list('gist_stern_inv',
                                             ['blue', 'red'], N=256)


## Data Management ----------------------------------
RP = True #Temporary initiation, will automatically change in workflow

# Directory of main folder (working directory)
dirWork = '.'
os.chdir(dirWork)

# Input Hazard Path
dirDepths = os.path.join(dirWork, 'data')
if not os.path.exists(dirDepths):
    os.makedirs(dirDepths)
Download data#
In this section, the data required to run the risk analysis is downloaded.
Download flood depth rasters to the data folder if the file doesn’t exist.
River flood extent and flood depth are from the Copernicus Land Monitoring Service for different return periods at a 3 arc-seconds grid spacing (approx. 30-75 m in Europe depending on latitude).
This section can be modified to use local data.
#This workflow is using European data.
#Note: There is a known issue with Mollweide projections. Standard projection used is 'EPSG:4326'

timeout = 90    # Download time out in seconds
max_retries = 5  # Maximum number of download attempts
socket.setdefaulttimeout(timeout)

##Flood data download
urlData='https://jeodpp.jrc.ec.europa.eu/ftp/jrc-opendata/CEMS-EFAS/flood_hazard/'

for RP in ReturnPeriods:
    print(f'Return Period={str(RP)}')
    rastDepths = os.path.join(dirDepths, f'Europe_RP{RP}_filled_depth.tif')
    if os.path.exists(rastDepths):
        print(f'Flood depth raster already exists (skipping download): {rastDepths}')
    else:
        rastTif = f'Europe_RP{RP}_filled_depth.tif'
        pathRastTif = os.path.join(dirDepths, rastTif)
        urlRastTif = os.path.join(urlData, rastTif)
        print(urlRastTif)
        for attempt in range(1, max_retries + 1):
            print(f'    Attempt: {attempt}')
            try:
                urllib.request.urlretrieve(urlRastTif, pathRastTif)
                break  # Break loop if download is successful
            except Exception as e:
                print('      Timeout.  Retry data download')
                if attempt == max_retries:
                    print('    Maximum number of timeouts reached.  Data download failed')
                    print(f'      Consider increasing timeout value {timeout} seconds')
                    print(f'      Consider increasing maximum number of download attempts {max_retries}')
                    raise Exception(f'Timeout time {timeout} seconds exceeded {max_retries}')
        print('  Unzipping downloaded file')
Return Period=10
Flood depth raster already exists (skipping download): .\data\Europe_RP10_filled_depth.tif
Return Period=50
Flood depth raster already exists (skipping download): .\data\Europe_RP50_filled_depth.tif
Return Period=100
Flood depth raster already exists (skipping download): .\data\Europe_RP100_filled_depth.tif
Return Period=500
Flood depth raster already exists (skipping download): .\data\Europe_RP500_filled_depth.tif
Retrieving flood map data for the area of interest#
In this section the bounding box is used to crop the data to the area of interest. The code converts latitude and longitude values to the equivalent projection used by the flood map raster & writes bounding box to shapefile.
If the region of interest is not as desired, the latitude and longitude values can be changed in the “Define inputs” section above.
# Determine Raster EPSG Code (only works with osgeo)
ds = gdal.Open(rastDepths)
srs = osr.SpatialReference()
srs.ImportFromWkt(ds.GetProjection())
epsgRast = f'EPSG:{srs.GetAuthorityCode(None)}'
ds = None
print(f'Water Depth Raster Projection: {epsgRast}')
# Create a transformer for coordinate conversion
transformer = Transformer.from_crs('EPSG:4326', epsgRast, always_xy=True)
# Convert bounding box coordinates to raster CRS
xMin, yMin = transformer.transform(Longitude1, Latitude1)
xMax, yMax = transformer.transform(Longitude2, Latitude2)
# Ensure xMin < xMax and yMin < yMax
xMin, xMax = min(xMin, xMax), max(xMin, xMax)
yMin, yMax = min(yMin, yMax), max(yMin, yMax)
print('Converted Coordinate Bounds:')
print(f' Longitudes: {Longitude1}E --> {xMin} meters & {Longitude2}E --> {xMax} meters')
print(f' Latitudes: {Latitude1}N --> {yMin} meters & {Latitude2}N --> {yMax} meters')
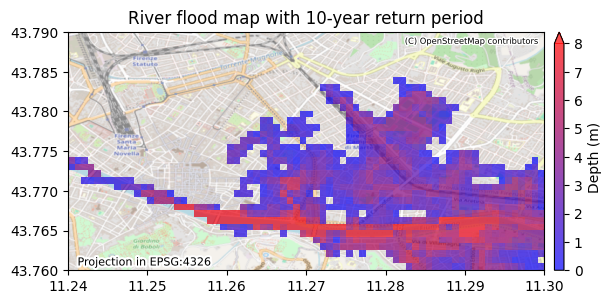
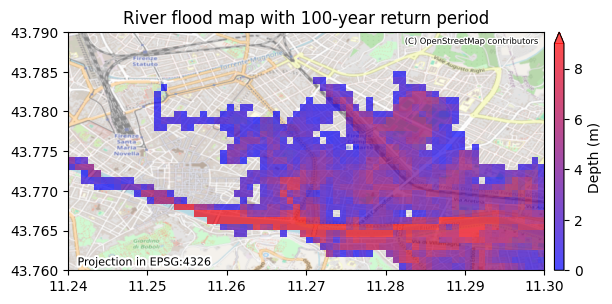
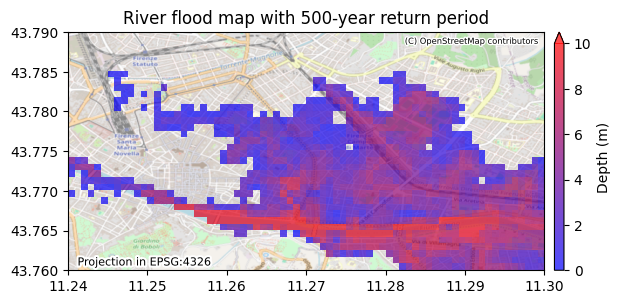
for RP in ImageReturnPeriod:
rastDepths = os.path.join(dirDepths, f'Europe_RP{RP}_filled_depth.tif')
# Read the raster using rasterio
with rasterio.open(rastDepths) as src:
window = from_bounds(xMin, yMin, xMax, yMax, src.transform)
rDepths = src.read(1, window=window)
rDepths = np.ma.masked_where((rDepths < -999) | (rDepths > 1000), rDepths)
# Compute the maximum value from the masked data
max_depth = rDepths.max()
# Find the closest multiple of 1 above the max_depth value
if customMaxDepthLegend is -1:
maxDepthLegend = ((max_depth // 1) + 1)
else:
maxDepthLegend=customMaxDepthLegend
missing_data_value = src.nodata
# Check select bounding latitude-longitude box
fig, ax = plt.subplots()
im = ax.imshow(rDepths, vmin=0, vmax=maxDepthLegend, cmap=cmap_h2o, extent=(xMin, xMax, yMin, yMax),
zorder=2, alpha=.7)
plt.title(f'River flood map with {RP}-year return period')
divider = make_axes_locatable(ax)
cax = divider.append_axes("right", size="2%", pad=0.1)
plt.colorbar(im, cax=cax,label='Depth (m)',extend='max')
plt.text(.02,.02,f'Projection in {epsgRast}', fontsize=8,
path_effects=[pe.withStroke(linewidth=3, foreground="white")], transform=ax.transAxes)
ctx.add_basemap(ax=ax, crs=epsgRast, source=ctx.providers.OpenStreetMap.Mapnik, attribution_size='6', alpha=.85)
txt = ax.texts[-1]
txt.set_position([0.99,0.98])
txt.set_ha('right')
txt.set_va('top')
plt.show()
Water Depth Raster Projection: EPSG:4326
Converted Coordinate Bounds:
  Longitudes: 11.24E --> 11.24 meters & 11.3E --> 11.3 meters
  Latitudes: 43.76N --> 43.76 meters & 43.79N --> 43.79 meters
<>:35: SyntaxWarning: "is" with a literal. Did you mean "=="?
<>:35: SyntaxWarning: "is" with a literal. Did you mean "=="?
C:\Users\Serrao\AppData\Local\Temp\ipykernel_25112\1491499586.py:35: SyntaxWarning: "is" with a literal. Did you mean "=="?
  if customMaxDepthLegend is -1:

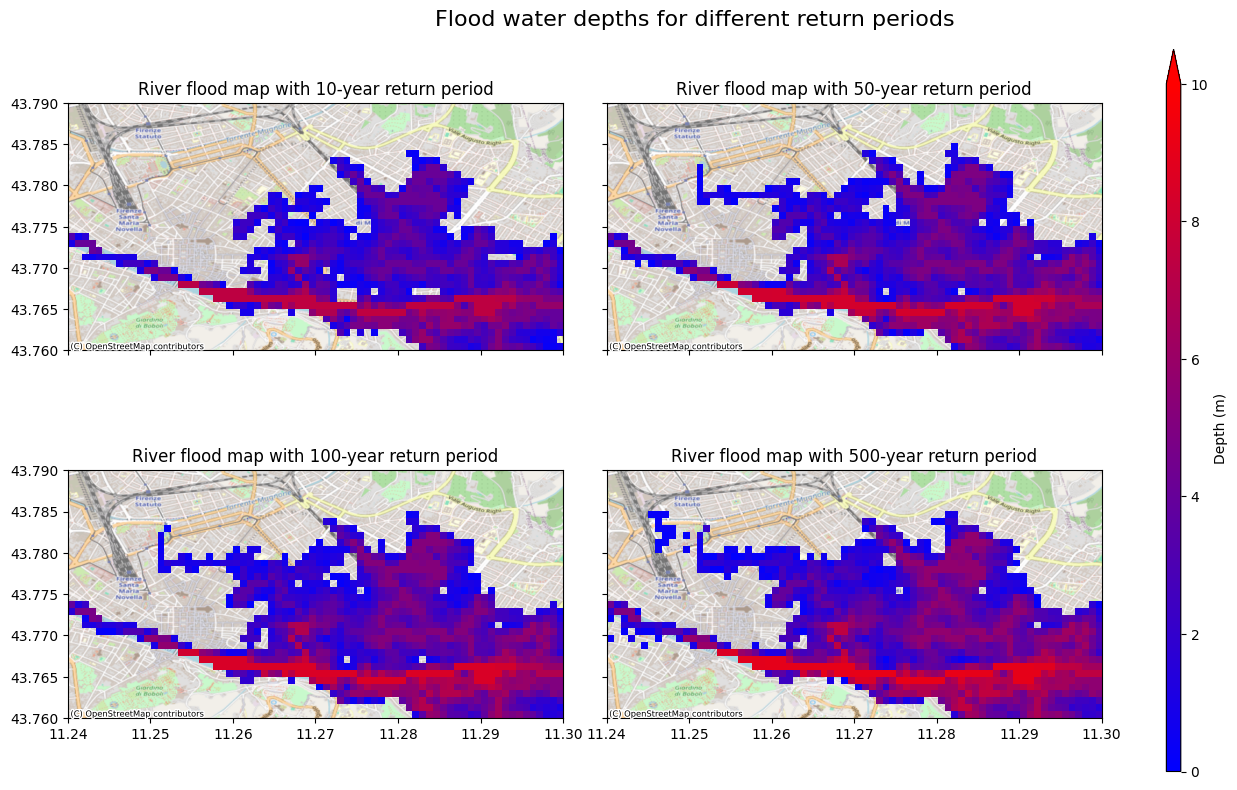
Plotting the data#
In this section additional informative graphics are generated:
All the floodmaps in a single graphic, as a quick overview of all the different return periods.
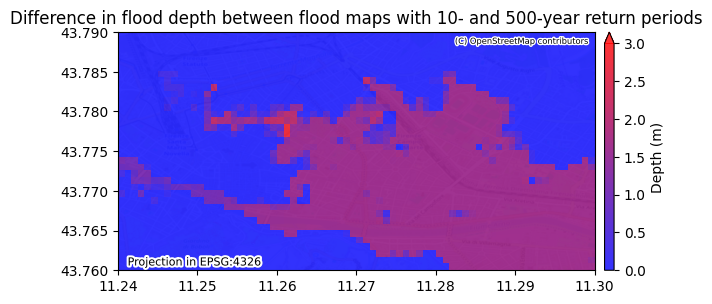
Comparison between two chosen return periods, to see how the flood depth may vary depending on the probability of the event (return period).
if flagFloodComposed is True:
    plotRows, plotCols = 2,2 #modify depending on number of flood maps generated (excess subplots will be set invisible)
    fig, axs = plt.subplots(nrows=plotRows, ncols=plotCols, figsize=(14,8), sharey=True,sharex=True) #change figsize to approriate value
    count,row,col=0,0,0
    maxDepthLegend=0 #Finding max depth for a common legend
    for RP in ImageReturnPeriod:
        rastDepths = os.path.join(dirDepths, f'Europe_RP{RP}_filled_depth.tif')
        with rasterio.open(rastDepths) as src:
            window = from_bounds(xMin, yMin, xMax, yMax, src.transform)
            rDepths = src.read(1, window=window)
            rDepths = np.ma.masked_where((rDepths < -999) | (rDepths > 1000), rDepths)
            # Compute the maximum value from the masked data
            if customMaxDepthLegend is -1:
                max_depth  = rDepths.max()
                max_depth = ((max_depth // 1) + 1)
            else:
                max_depth=customMaxDepthLegend
            missing_data_value = src.nodata
        if max_depth>maxDepthLegend:
            maxDepthLegend=max_depth

    for j, RP in enumerate(ImageReturnPeriod):
        if count==plotCols:
            row=row+1
            col=0
        rastDepths = os.path.join(dirDepths, f'Europe_RP{RP}_filled_depth.tif')
        with rasterio.open(rastDepths) as src:
            window = from_bounds(xMin, yMin, xMax, yMax, src.transform)
            rDepths = src.read(1, window=window)
            rDepths = np.ma.masked_where((rDepths < -999) | (rDepths > 1000), rDepths)
            missing_data_value = src.nodata
        im = axs[row,col].imshow(rDepths, vmin=0, vmax=maxDepthLegend, cmap=cmap_h2o, extent=(xMin, xMax, yMin, yMax),
                    zorder=2, alpha=1)
        axs[row,col].set_title(f'River flood map with {RP}-year return period')
        ctx.add_basemap(ax=axs[row,col], crs=epsgRast, source=ctx.providers.OpenStreetMap.Mapnik, attribution_size='6', alpha=1)
        count, col=count+1, col+1
    #Removing unused spaces
    for i in range(j + 1, plotRows * plotCols):
        row = i // plotCols
        col = i % plotCols
        axs[row, col].set_visible(False)
    fig.suptitle('Flood water depths for different return periods', fontsize=16)
    fig.tight_layout()
    cbar = fig.colorbar(im, ax=axs, orientation='vertical', label='Depth (m)', extend='max',aspect=50)
    plt.show()

#Difference between maps --------------------
if len(ImageReturnPeriod)>1 and flagFloodDifference is True:
    RPmin=np.min(ImageReturnPeriod) #Setting the smallest and largest RPs, can manually decide which two to compare
    RPmax=np.max(ImageReturnPeriod)
    rastDepths_min = os.path.join(dirDepths, f'Europe_RP{RPmin}_filled_depth.tif')
    rastDepths_max = os.path.join(dirDepths, f'Europe_RP{RPmax}_filled_depth.tif')
    with rasterio.open(rastDepths_min) as flood_src_min:
        window = from_bounds(xMin, yMin, xMax, yMax, src.transform)
        rastDepths_data_min = flood_src_min.read(1,window=window)
        nodata_min = flood_src_min.nodata
        rastDepths_data_min[rastDepths_data_min == nodata_min] = 0  # Set NoData to 0
        rastDepths_data_min = np.ma.masked_where((rastDepths_data_min < -999) | (rastDepths_data_min > 1000), rastDepths_data_min)

    with rasterio.open(rastDepths_max) as flood_src_max:
        window = from_bounds(xMin, yMin, xMax, yMax, src.transform)
        rastDepths_data_max = flood_src_max.read(1,window=window)
        nodata_max = flood_src_max.nodata
        rastDepths_data_max[rastDepths_data_max == nodata_max] = 0  # Set NoData to 0
        rastDepths_data_max = np.ma.masked_where((rastDepths_data_max < -999) | (rastDepths_data_max > 1000), rastDepths_data_max)

    rastDepths_data = rastDepths_data_max - rastDepths_data_min
    max_depth  = rastDepths_data.max()
    min_depth  = rastDepths_data.min()
    # Find the legend extremes
    maxDepthLegend = ((max_depth // 1) + 1)
    minDepthLegend = ((min_depth // 1))
    result_raster = os.path.join(dirDepths, f'Europe_Flood_difference_RP{RPmin}_RP{RPmax}.tif')
    with rasterio.open(
        result_raster,
        'w',
        driver='GTiff',
        height=rastDepths_data.shape[0],
        width=rastDepths_data.shape[1],
        count=1,
        dtype=rastDepths_data.dtype,
        crs=src.crs,
        transform=src.transform,
    ) as dst:
        dst.write(rastDepths_data, 1)

    fig, ax = plt.subplots()
    plt.title(f'Difference in flood depth between flood maps with {RPmin}- and {RPmax}-year return periods')
    im = ax.imshow(rastDepths_data, vmin=minDepthLegend, vmax=maxDepthLegend, cmap=cmap_h2o, extent=(xMin, xMax, yMin, yMax),
                    zorder=1, alpha=0.8)
    divider = make_axes_locatable(ax)
    cax = divider.append_axes("right", size="2%", pad=0.1)
    plt.colorbar(im, cax=cax,label='Depth (m)',extend='max')
    plt.text(.02,.02,f'Projection in {epsgRast}', fontsize=8,
            path_effects=[pe.withStroke(linewidth=3, foreground="white")], transform=ax.transAxes)
    ctx.add_basemap(ax=ax, crs=epsgRast, source=ctx.providers.OpenStreetMap.Mapnik, attribution_size='6', alpha=0.4)
    txt = ax.texts[-1]
    txt.set_position([0.99,0.98])
    txt.set_ha('right')
    txt.set_va('top')
    plt.show()
<>:13: SyntaxWarning: "is" with a literal. Did you mean "=="?
<>:13: SyntaxWarning: "is" with a literal. Did you mean "=="?
C:\Users\Serrao\AppData\Local\Temp\ipykernel_25112\3183570456.py:13: SyntaxWarning: "is" with a literal. Did you mean "=="?
  if customMaxDepthLegend is -1:
Conclusion#
In the hazard assessment:
The appropriate flood data was downloaded from online sources.
The data was manipulated to have smaller files that only include the area of interest.
All the return periods of interest were plotted.
A map showcasing the difference in flood depths between two return periods was produced.
The majority of this code will also be present in the risk assessment, yet since the workflow will check if the data was already downloaded, running the hazard assessment first will not cause datasets to be downloaded twice.