Wildfire workflow: FWI response to climate change and affected population#
This workflow is designed to support the estimation of regional wildfire hazard and the population affected in the context of climate change.
Introduction#
Wildfire hazard depends on the local climatic conditions of a region, among other factors. In a changing climate, we can therefore expect changes to the potential for fire development. While an increase in mean temperature is likely to extend the length of the traditional fire season in already susceptible regions, the atmosphere is also able to hold and carry additional moisture in a warmer climate, potentially offseting an increase of fire hazard based on temperature alone. It is therefore important to consider multiple influential variables in combination to get a reliable picture of the response of wildfire susceptibility to climate change.
Fire Weather Index (FWI)
The FWI is a component of the Canadian Forest Fire Weather Index System, serving as a numerical measure of fire intensity. It is derived from weather observations including temperature, humidity, wind speed, and precipitation. The FWI is instrumental in estimating the potential land flammability and severity of wildfires, thereby helping in fire management and mitigation efforts.
Probability of exceedance
This statistical measure indicates the likelihood that a certain variable, here the FWI, will surpass a predefined threshold in a year. It is expressed as a probability from 0 to 1 where a higher value signifies a greater chance of exceeding the specified FWI threshold. Understanding the probability of exceedance helps to assess fire risk under various climate scenarios and making informed decisions for fire prevention and safety planning.
Impact response surface (IRS)
A model for the response of a dependent variable (here: the probability of exceedance of a FWI threshold) to changes in a set of explanatory variables (here: mean temperature and precipitation). The IRS is constructed empirically from a reference dataset of both the explanatory and corresponding dependent variables. Once constructed, it can be used to evaluate a response and the associated sensitivity to uncertainty for given values of the explanatory variables within the range covered by the reference dataset.
Hazard assessment methodology#
In this workflow, the potential for wildfire development is quantified by the Fire Weather Index (FWI), which combines multiple atmospheric variables into an assessment of fire danger. The response of local FWI statistics is modelled as a function of changes to both mean temperature and precipitation (relative to a baseline climate), using the methodology and simulations of El Garroussi et al. (2024). The constructed response model can be applied to projections of temperature and precipitation from climate models to estimate future changes to regional FWI statistics and their sensitivity to model uncertainty.
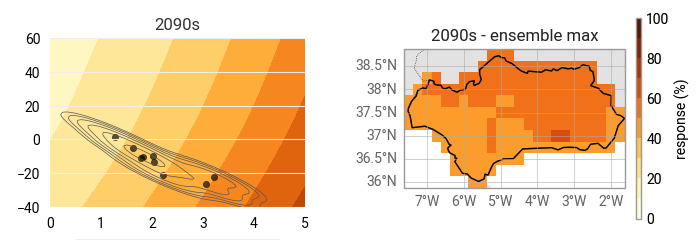
Fig. 31 Hazard assessment output examples: impact response surface for the probability of exceedance of a selected FWI threshold with projections of temperature and precipitation overlaid (left) and spatially resolved response (right).#
The hazard assessment has three parts (one notebook each):
Advantages#
Once constructed, the response model can be used to estimate FWI statistics for a wide range of temperature and precipitation change scenarios. Projections of temperature and precipitation change for which no corresponding FWI data are available can be utilized.
The impact response surface can easily be visualized and analysed in the space of mean temperature and precipitation changes, e.g. by plotting the yearly probability of exceedance for a given FWI threshold.
The response model predicts statistics of the FWI, even if the temperature and precipitation change under consideration would otherwise not be suitable to reliably compute statistics.
Sensitivity to uncertainty along a given temperature-precipitation change trajectory can be estimated with the response model.
Limitations#
The FWI is designed to assess the potential for wildfire based on atmospheric variables and their temporal evolution. The index does not take the actual land use and availability of burnable material into account.
Computing the response of FWI statistics as a function of temperature and precipitation only is a simplification of climate change and the FWI, which, e.g., also depends on wind conditions.
Data to construct the response surface is only available for geographical Europe and the Mediterranean (approx. 30°N–72°N, 10°W–40°E).
Risk assessment methodology#
Count the population affected at specific levels of hazard.
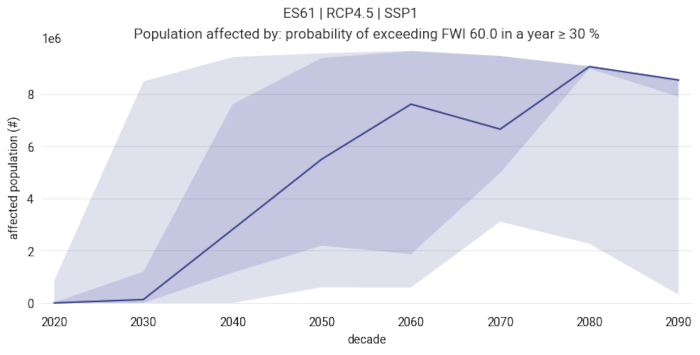
Fig. 32 Risk assessment output example: the projected evolution of the population living in an area where a wildfire hazard threshold is exceeded.#
The risk assessment consists of the affected population notebook.
Datasets#
Simulations of FWI with CMIP6-informed perturbations
The reference dataset from which the response model is built consists of a set of simulations of historical FWI, based on ERA5 reanalysis data. Simulations in the set are perturbed such that the mean temperature change covers a range from 0 to +5°C and the mean precipitation change a range from -40% to +60% relative to the actual historical climate as represented by the reanalysis data. The perturbations imposed on the simulations are informed by CMIP6 model runs such that they represent realistic patterns of climate change.
The output of the simulations is available from Zenodo (El Garroussi 2024). For this workflows, we offer to possibility to access the dataset through a mirror that is provided by the CLIMAAX project. The mirror provides a more convenient data layout for a local analysis as carried out in this workflow.
Yearly climate indicators from reanalysis and EURO-CORDEX
The dataset Climate indicators for Europe from 1940 to 2100 derived from reanalysis and climate projections on the Copernicus Climate Data Store contains projections of yearly-mean temperature and precipitation from EURO-CORDEX models. We choose this dataset here mainly because it is convenient to access and relatively small in size. The dataset covers geographical Europe at a moderate spatial resolution of 0.25° horizontal.
Global population projections for 5 SSP scenarios
Based on WorldPop population data and a random forest algorithm, Wang et al. (2022) created a global gridded population dataset at 30 arcsecond (approximately 1 km) spatial resolution for the period 2020–2100. The dataset is quantitatively consistent with the shared socioeconomic pathways (SSPs) national population and available from Zenodo.
Tip
The impact response surface methodology allows for the use of a large variety of mean temperature and precipitation projections for the future climate. Workflow users are encouraged to insert projections that have been tailored to their specific region of interest, e.g., from a high(er)-resolution regional modelling effort or bias-corrected statistical downscaling.
References#
El Garroussi, S., Di Giuseppe, F., Barnard, C. et al. Europe faces up to tenfold increase in extreme fires in a warming climate. npj Clim Atmos Sci 7, 30 (2024). https://doi.org/10.1038/s41612-024-00575-8
El Garroussi, S. (2024). 30-Year Canadian Fire Weather Index Simulations over Europe: CMIP6-Informed Temperature and Precipitation Perturbations [Data set]. Zenodo. https://doi.org/10.5281/zenodo.10458186