Hazard datasets#
Climate risk is calculated from the combination of:
Hazard × Vulnerability × Exposure = Risk
Within this equation, the hazard is often the dominant factor. The IPCC Assessment Reports have played a key role in shaping the role of hazard in climate risk conceptualization, as it is essential for understanding the potential intensity, frequency, and spatial distribution of climate risk.
This page provides references to open-access datasets that characterize natural climate-related hazards for the past, present and future. The collected entries are broadly categorized into general datasets that characterize the state of the Earth system and datasets created to quantify specific hazards. The collection is not complete and favours datasets with global or European coverage.
Tip
We highly recommend considering alternative and complementary local datasets for a risk analysis in addition to the options listed here. Contact to your local meteorological service and search for other providers of data tailored to your area of interest. Look out especially for regional climate model projections and statistically downscaled and bias-corrected datasets that take into account local conditions. Some information may only be accessible in the local language.
General climate datasets#
These are datasets of quantities that characterize the Earth system in general. For use a meaningful hazard indicator, they usually require further processing. Available variables include atmospheric temperature, wind speed and precipitation but also information about the state of other Earth system components, e.g., soil properties.
Observations#
Observations comprise information from surface weather stations and other platforms that monitor the state of the Earth system like aircraft and satellites. Consistent and quality-controlled timeseries of observations can be a source of reliable and accurate local information. Some stations have long historical records suitable for analysis of the local climate of the past. However, differences in measurement techniques and equipment can complicate comparisons between or the merging of observational records in time and space.
The spatial and temporal coverage of station data can be incomplete and highly local events, e.g., precipitation extremes, may be missed by the network. Satellites in a polar orbit can provide high spatial resolution and cover large areas in general but only pass infrequently over a specific area. Geostationary satellites provide temporally continuous coverage of areas in their field of view but often at lower spatial resolution and non-favourable viewing angles at higher latitudes. Gridded observation datasets aim to fill coverage gaps by combining observations from different sources with interpolation and statistical techniques.
E-OBS
Daily gridded observational dataset for precipitation, temperature, sea level pressure, relative humidity, wind speed and global radiation in Europe based on ECA&D information.
- Dataset
- Temporal coverage
1950 to near-present
- Spatial coverage
25°N-71.5°N, 25°W-45°E
- Resolution
0.1° and 0.25° horizontal
CHIRPS
Rainfall Estimates from Rain Gauge and Satellite Observations.
- Dataset
- Temporal coverage
1981 to near-present
- Spatial coverage
50°S-50°N
- Resolution
0.05° horizontal
Landsat C2L1
A product from the Landsat missions of Earth observation satellites. Collection 2 is a major reprocessing effort of the Landsat archive, with calibrated multispectral images provided as Level-1 data. Spectral band coverage changes with sensors on newer satellites.
- Dataset
USGS product page and EarthExplorer
- Temporal coverage
Landsat 1 launched in 1972; newest OLI and TIRS sensors on Landsat 8 and 9 since Februrary 2013
- Spatial coverage
global, completed about every 18 days
- In workflows
Reanalysis#
Reanalysis products are recreations of the state of the Earth system by a computer model to which a variety of available observations are given as inputs. Reanalysis datasets provide complete and consistent gridded information in time and space, which simplifies data processing. They can be considered a best model estimate for the state of the atmosphere and related components, but do not generally reproduce observational records even if these records were provided to the producing model as input. In the reanalysis method, the individual strengths of the computer model and observational record complement the weaknesses of the other and thereby usually improve upon simpler interpolation schemes. Values of variables in reanalysis datasets usually represent the average conditions in the associated grid boxes. Modern reanalysis products also offer explicit estimates of uncertainty from the modelling system.
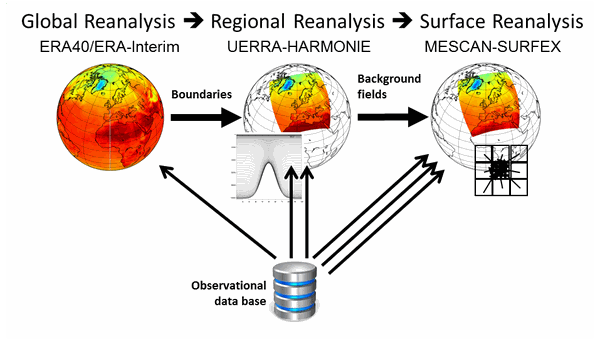
Fig. 10 A global reanalysis provides the boundary conditions for a regional reanalysis, which in turn provides the background for a specialized surface reanalysis. As the modelling of local conditions improves with increasingly specialized models, more observations can be considered in a given area. Source: UERRA data user guide.#
ERA5
Atmospheric reanalysis dataset produced by the European Centre for Medium-Range Weather Forecasts (ECMWF), widely used in climate research, weather forecasting, and other applications. Includes an ensemble component at half the resolution to provide information on synoptic uncertainty.
- Dataset
hourly data on single levels, hourly data on pressure levels, hourly time series on single levels
- Temporal coverage
1940 to near-present
- Spatial coverage
global
- Resolution
0.25° horizontal
- In workflows
ERA5-Land
ERA5-Land has higher horizontal resolution compared to ERA5, but only covers land areas. ERA5-land parameter uncertainty can be accessed using the equivalent ERA5 fields.
- Dataset
- Temporal coverage
1950 to near-present
- Spatial coverage
global
- Resolution
0.1° horizontal
CERRA
The Copernicus European Regional ReAnalysis. Inputs are the observational data, lateral boundary conditions from ERA5 global reanalysis and physiographic datasets describing surface characteristics.
- Dataset
single levels, pressure levels, height levels and land component
- Documentation
- Temporal coverage
1984 to 2022
- Spatial coverage
Europe, parts of the North Atlantic and North Africa
- Resolution
5.5 km horizontal
UERRA-HARMONIE & MESCAN-SURFEX
Regional reanalysis for Europe produced by the Uncertainties in Ensembles of Regional ReAnalyses project.
- Dataset
single levels, pressure levels, height levels and soil levels
- Temporal coverage
January 1961 to July 2019
- Spatial coverage
Europe
- Resolution
11 km (UERRA-HARMONIE) and 5.5 km (MESCAN-SURFEX) horizontal
- In workflows
Climate model projections#
These datasets are produced by simulations of the Earth system with climate models. As for reanalysis (Fig. 10), there are global climate models (GCMs) and regional climate models (RCMs), with the latter driven by boundary conditions from the former. Climate model runs are usually started in the past and provide a consistent dataset of the historical and future climate. These consistent datasets are important to account for biases, i.e., models’ individual preferences for under- or overestimating the values of output variables. By simulating the past as well as the future, biases can be corrected through comparison with other historical data records and change signals can be assessed within each simulation without the introduction of model bias. Projections of climate models depend on assumptions about drivers of the Earth system, which are formalized in emissions scenarios and socioeconomic pathways.
Climate models represent physical processes in varying degrees of simplification. This reduces computational costs but limits how well these processes and their effects are (re)produced in simulations. E.g., many clouds and orographic effects occur at spatial and temporal scales not explicitly resolved by current climate models. Because each model has its specific representation of the Earth system, projected changes differ between models for the same scenarios. Chaos and stochasticity in the Earth system additionally mean that multiple runs with the same model and scenario do not produce identical projections. To account for the inherent uncertainties of climate modelling in quantitative CRA, multiple projections (so-called ensembles) from a single or multiple models should ideally be considered.
CMIP6
Global climate model simulations produced for phase 6 of the Coupled Model Intercomparison Project (CMIP). Daily and monthly projections of the historical and future climate from a large number of experiments and models under different scenarios of greenhouse gas emissions.
- Dataset
- Temporal coverage
1850-2014 (historical), 2015-2100 (future)
- Scenarios
SSP1-1.9, SSP1-2.6, SSP4-3.4, SSP5-3.4OS, SSP2-4.5, SSP4-6.0, SSP3-7.0, SSP5-8.5
- Spatial coverage
global
- Resolution
depending on model
CMIP5
Global climate model simulations produced for phase 5 of the Coupled Model Intercomparison Project (CMIP). Daily and monthly projections of the historical and future climate from a large number of experiments and models under different scenarios of greenhouse gas emissions.
- Dataset
- Temporal coverage
1850 to 2300 (depending on experiment)
- Scenarios
RCP 2.6, 4.5, 6.0, 8.5
- Spatial coverage
global
- Resolution
0.125° to 5° horizontal (depending on model)
CORDEX
High-resolution regional climate model simulations for Europe, produced by a consortium of European research institutions within the Coordinated Regional Climate Downscaling Experiment. Boundary conditions for the regional climate models come from global climate models of CMIP5.
- Dataset
- Documentation
- Temporal coverage
1951-2005 (historical), 1989-2008 (evaluation), 2006-2100 (future)
- Scenarios
RCP 2.6, 4.5, 8.5 (depending on domain and model)
- Spatial coverage
- Resolution
0.11° to 0.44° horizontal (depending on domain and model)
- In workflows
 Extreme precipitation,
 Urban heatwaves,
 Agricultural drought,
 Heavy snowfall & blizzards,
Multi-hazard Infrastructure
Heavy snowfall & blizzards,
Multi-hazard Infrastructure
ISIMIP3b
The Inter-Sectoral Impact Model Intercomparison Project (ISIMIP) provides bias-corrected and statistically downscaled CMIP6 atmospheric climate data. The bias-adjustment corrects the simulated data towards corrected ERA5 reanalysis (W5E5).
- Dataset
- Documentation
- Temporal coverage
1601-1849 (pre-industrial), 1850-2014 (historical), 2015-2100 (future)
- Scenarios
SSP1-RCP2.6, SSP3-RCP7.0, SSP5-RCP8.5
- Spatial coverage
global
- Resolution
0.5°, 1° or 2° horizontal (depending on variable)
- In workflows
ECLIPS-2.0
Bias-corrected and downscaled data of five EURO-CORDEX regional climate models and two greenhouse gas concentration scenarios. 80 annual, seasonal and monthly climate variables for two past and five future periods.
- Dataset
- Documentation
- Temporal coverage
1961-1990, 1991-2010, 2011-2020, 2021-2140, 2041-2060, 2061-2080, 2081-2100
- Scenarios
RCP 4.5, 8.5
- Spatial coverage
EURO-CORDEX domain
- Resolution
30 arcsec horizontal
- In workflows
CHELSA-EUR11
Downscaled climate model output of temperature and precipitation estimates from the Climatologies at high resolution for the earth’s land surface areas (CHELSA) dataset.
- Dataset
- Documentation
- Temporal coverage
1981-2000, 1981-2005, 2021-2040, 2041-2060, 2051-2080, 2061-2080
- Scenarios
RCP 4.5, 8.5
- Spatial coverage
EURO-CORDEX domain
- Resolution
30 arcsec horizontal
- In workflows
Hazard-specific datasets#
Hazard-specific datasets are often created from observational, reanalysis or climate datasets. Additional processing steps have been applied to quantify a specific hazard more directly and to derive indicators that quantify the severity of the hazard. This ranges from the detection of hazardous events and basic statistical summaries of climate variables in an easy-to-access format to datasets generated with dedicated hazard models to produce hazard indicators. Due to their direct relevance for CRA, hazard-specific datasets are generally more easy to use. However, decisions made in the processing of the data, e.g., on thresholds that define a hazardous event, may not be suitable for all use cases.
 Floods#
JRC river flood hazard maps for Europe and the Mediterranean Basin region
Gridded inundation depth (in m) along the river network, for nine different flood return periods (from 1-in-10-years to 1-in-500-years).
- Dataset
http://data.europa.eu/89h/1d128b6c-a4ee-4858-9e34-6210707f3c81
- Spatial coverage
Most of geographical Europe and all the river basins entering the Mediterranean and Black Seas in the Caucasus, Middle East and Northern Africa countries. River basins > 150 km².
- Resolution
3’’ x 3’’ horizontal (30-75 m)
- In workflows
- River floods (flood maps),
Flood building damage and population exposed
WRI Aqueduct Floods Hazard Maps
Gridded dataset of inundation depth (in m) corresponding to extreme flood events with a range of return periods (2, 5, 10, 25, 50, 100, 250, 500 and 1000 years) for multiple climate scenarios (RCP4.5 and RCP8.5) and projection time horizons (2030, 2050, 2080). The flood maps are available based on 5 climate models. Please note that this is a global dataset associated with a large degree of uncertainty.
- Dataset
- Documentation
- Temporal coverage
1980, 2030, 2050, 2080
- Scenarios
RCP4.5/SSP2, RCP8.5/SSP2, RCP8.5/SSP3
- Spatial coverage
global
- Resolution
30’’ x 30’’ horizontal (300-750 m in Europe)
- In workflows
Deltares Global Flood Maps
Global flood maps dataset for coastal flood hazard under the present-day climate (ca. 2018) and projections for 2050 (RCP8.5 climate scenario). Within each scenario several flood maps are available, corresponding to extreme sea storms with different return periods. The dataset is based on extreme values derived from a global dataset of storm surges combined with sea level rise projections.
- Dataset
https://planetarycomputer.microsoft.com/dataset/deltares-floods
- Temporal coverage
2018, 2050
- Scenarios
RCP8.5/SSP2, RCP8.5/SSP3
- Spatial coverage
global
- Resolution
3’’ x 3’’ horizontal (30-75 m in Europe)
- In workflows
Global sea level change timeseries and indicators from 1950 to present day derived from reanalysis
Timeseries and statistical indicators of tides, storm surges and sea level that can be used to characterize global sea level in present-day conditions. This dataset provides information on tides and can be used to compute extremes of water levels and surges. Surge projections under climate scenarios up to 2050 are also available, but due to high degree of uncertainty in local applications these are not used in the workflows.
- Dataset
- Temporal coverage
1950 to 2024
- Spatial coverage
global
- In workflows
IPCC 6th Assessment Report Sea Level Projections
Sea-level projections associated with the Intergovernmental Panel on Climate Change Sixth Assessment Report.
- Dataset
- Temporal coverage
2020 to 2150
- Scenarios
SSP1-1.9, SSP1-2.6, SSP2-4.5, SSP3-7.0, SSP5-8.5
- Spatial coverage
global
- In workflows
Hydrology-related climate impact indicators from 1970 to 2100 derived from bias adjusted European climate projections
Daily mean river discharge and a set of climate impact indicators for water quantity and quality based on hydrological impact modelling, forced by bias adjusted regional climate simulations from EURO-CORDEX.
- Dataset
- Temporal coverage
1970 to 2100
- Spatial coverage
Europe (E-HYPE domain with 8.8 million km², subdivided into 35408 subcatchments)
- Resolution
5 km x 5 km horizontal and catchments
- In workflows
Heatwaves#
Heat waves and cold spells in Europe derived from climate projections
Number of hot and cold spell days using different European-wide and national/regional definitions developed within the C3S European Health service.
- Dataset
- Temporal coverage
1986 to 2085
- Spatial coverage
European region (approx. 27°N–72°N and 22°W–45°E)
- Resolution
0.1° x 0.1° regular latitude-longitude grid
- In workflows
Online Global Land Surface Temperature Estimation from Landsat
Temperature of the Earth’s surface (as it would feel to the touch), estimated from a combination of Landsat images from different spectral bands.
- Dataset
- Documentation
- Temporal coverage
past; depending on satellite
- Spatial coverage
global, completed about every 18 days
- In workflows
 Fire#
Fire#
Fire danger indicators for Europe from 1970 to 2098 derived from climate projections
Projections of fire danger indicators for Europe based upon the Canadian Fire Weather Index System (FWI) under future climate conditions
- Dataset
- Temporal coverage
1970 to 2098
- Spatial coverage
Europe
- Spatial resolution
0.11° x 0.11° horizontal
- In workflows
30-Year Canadian Fire Weather Index Simulations over Europe: CMIP6-Informed Temperature and Precipitation Perturbations
30-year Canadian Fire Weather Index (FWI), generated using the Global ECMWF Fire Forecast model, forced by ERA5 reanalysis data (1981-2010). Simulations incorporate perturbations in temperature and precipitation forcings based on CMIP6 climate projections under the SSP2-4.5 medium mitigation scenario.
- Dataset
- Temporal coverage
1981 to 2010
- Spatial coverage
Europe (geographical)
- Resolution
31 km horizontal
- In workflows
 Wind#
Wind#
Windstorm tracks and footprints derived from reanalysis over Europe between 1940 to present
Climate indicators of windstorms associated with extratropical cyclones, derived from ERA5 over a pan-European domain.
- Dataset
- Temporal coverage
1940 to present
- Spatial coverage
25°W-35°E, 30°N-70°N
- Resolution
0.016° horizontal (downscaled), 0.25° (ERA5 grid)
- In workflows
Winter windstorm indicators for Europe from 1979 to 2021 derived from reanalysis
Climatological indicators on European winter windstorms and their economic impact derived from ERA5 reanalysis.
- Dataset
- Temporal coverage
1979 to 2021; October to March
- Spatial coverage
20°W-35°E, 35°N-70°N
- Resolution
1 km horizontal
Synthetic windstorm events for Europe from 1986 to 2011
Synthetic set of plausible windstorm events windstorm events over Europe based on modelled climatic conditions.
- Dataset
- Temporal coverage
1986 to 2011; September to May
- Spatial coverage
25°W-40.5°E, 34.4°N-71.5°N
- Resolution
4.4 km horizontal (interpolated from 25 km)