Heatwave and precipitation risk assessment for infrastructure (airports)#
This workflow combines heatwave and extreme precipitation hazard assessment with infrastructure risk evaluation, specifically targeting airport facilities. It can utilize climate data from reanalysis datasets like UERRA and EURO-CORDEX regional climate projections to analyze historical conditions and explore future scenarios. The relative risk levels computed by the workflow can support the prioritization of adaptation measures for critical infrastructure.
The workflow computes hazard indicators from temperature and precipitation (extreme event counts, percentiles, return periods), visualizes their spatial patterns and projected changes, and integrates the hazard data with exposure and vulnerability factors to assess climate risks for specific locations.
The methodology is based on the risk assessment for airport infrastructure of de Vivo et al. (2023).
Input datasets#
By default, the workflow enables users to integrate UERRA regional reanalysis data and EURO-CORDEX climate projections into their risk assessment. They cover geographical Europe with horizontal resolutions of 5.5 km (UERRA) and up to 0.11° (~12.5 km, EURO-CORDEX).
Tip
Other datasets can be integrated if the required climate variables 2 m maximum temperature and total precipitation are available at daily frequency.
The exposure and vulnerability data for individual pieces of infrastructure must be supplied by the user in a tabular format. The comparative risk analysis methodology requires at least 2 entries in the infrastructure table, with more preferred to obain best results. In the preconfigured example, 9 airports are analysed together.
Hazard assessment#
Part 1: data retrieval and preparation#
UERRA reanalyis and EURO-CORDEX climate projections.
Output: climate datasets of daily maximum temperature and total precipitation for an area of interest.
Tip
EURO-CORDEX variables required to run the workflow as the same as used by the heatwave (xclim) and extreme precipitation workflows. If you have run these workflows already, it is likely that data already downloaded there can be reused here.
Part 2: computation of hazard#
Heatwave indicators from xclim, percentiles and return periods of extreme events.
Output: temperature hazard indicators (number days above critical thresholds per year, percentiles) and precipitation hazard indicators (percentiles, return levels of extreme events).
Part 3: visualisation of hazard#
Output: spatial maps of temperature and precipitation indicators and maps of change relative to a baseline climate.
Risk assessment#
Extract hazard data for airport locations, define exposure and vulnerability indicators for the infrastructure, and determine risk after normalisation of each contributing factor.
Output: risk scores combining hazard, exposure and vulnerability at specific point locations.
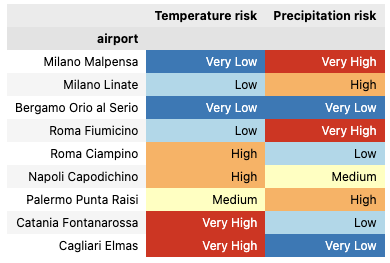
Fig. 40 Example of a risk table indicating categories of risk for individual locations produced by the risk assesment workflow.#
Contributors#
Giuseppe Giugliano (giuseppe.giugliano@cmcc.it)
Carmela de Vivo (carmela.devivo@cmcc.it)
Daniela Quintero (daniela.quintero@cmcc.it)